Investor Insights

SHARE
Half-year performance: A comparative analysis of Australia' big four banks
It has been a while since we reported on the major banks, which have now all provided half-year updates to their operating performance.
Before reporting on their results, I think it worthwhile to provide you with a usefully simplified framework for analysing or comparing a bank’s performance. Despite claims of complexity in their reporting and differentiation in their offerings, the big four banks are relatively simple businesses to understand at a high level, and broadly undifferentiated, offering everyday banking, loans, credit cards, wealth management and insurance.
Australian banks primarily earn money through lending, making a profit called a margin. This margin, also known as net interest income or net interest margin (NIM), is the difference between what a bank pays for deposits (a big source of its funding) and other funds and what it charges for loans. Typically, in a competitive market, this margin is about two per cent, while the annual return from the net interest margin on the bank’s total assets is also about two per cent.
The second source of monetary returns for Australian banks is proprietary trading and other services, including insurance and wealth management. In a good year, these can add 0.5-1.0 per cent to returns on total assets.
When both sources are combined, a successful bank can earn about 2.5-3.0 per cent in revenue from its assets annually.
As with any business, costs are associated with producing this revenue, not least of which are people, real estate, systems, and compliance. For Australia’s big four banks, about 50 per cent of their revenues are chewed up by these expenses, leaving a bank with its profit before bad and doubtful debts and tax. Bad debts are often called ‘credit impairments’ or something similarly sophisticated. What’s left is the bank’s return before bad debts and tax, which should, by deduction, amount to about 50 per cent on operating income.
In fact, ‘bad debt’ can occasionally throw a spanner in the works. Given a pre-tax return on total assets of about 1.25 to 1.5 per cent, if, for example, one per cent of a bank’s loan book should go sour, then a bank’s profit could be almost entirely wiped out for that year. So, it’s worth noting the huge operational leverage banks have, making them some of the most heavily levered businesses listed on the ASX.
Finally, there’s tax, which, in Australia, and in the absence of adjustments, typically amounting to 30 per cent of pre-tax profits.
The above framework provides a rough and ready analytical tool that will help you compare the performance of banks anywhere in the world. The suggested benchmarks are:
- Revenue returns on total assets of two per cent for net interest margin,
- One per cent return on total assets for other income, and
- A 50 per cent cost-to-income ratio efficiency after-tax, which is equivalent to a 1.0 per cent return on total assets.
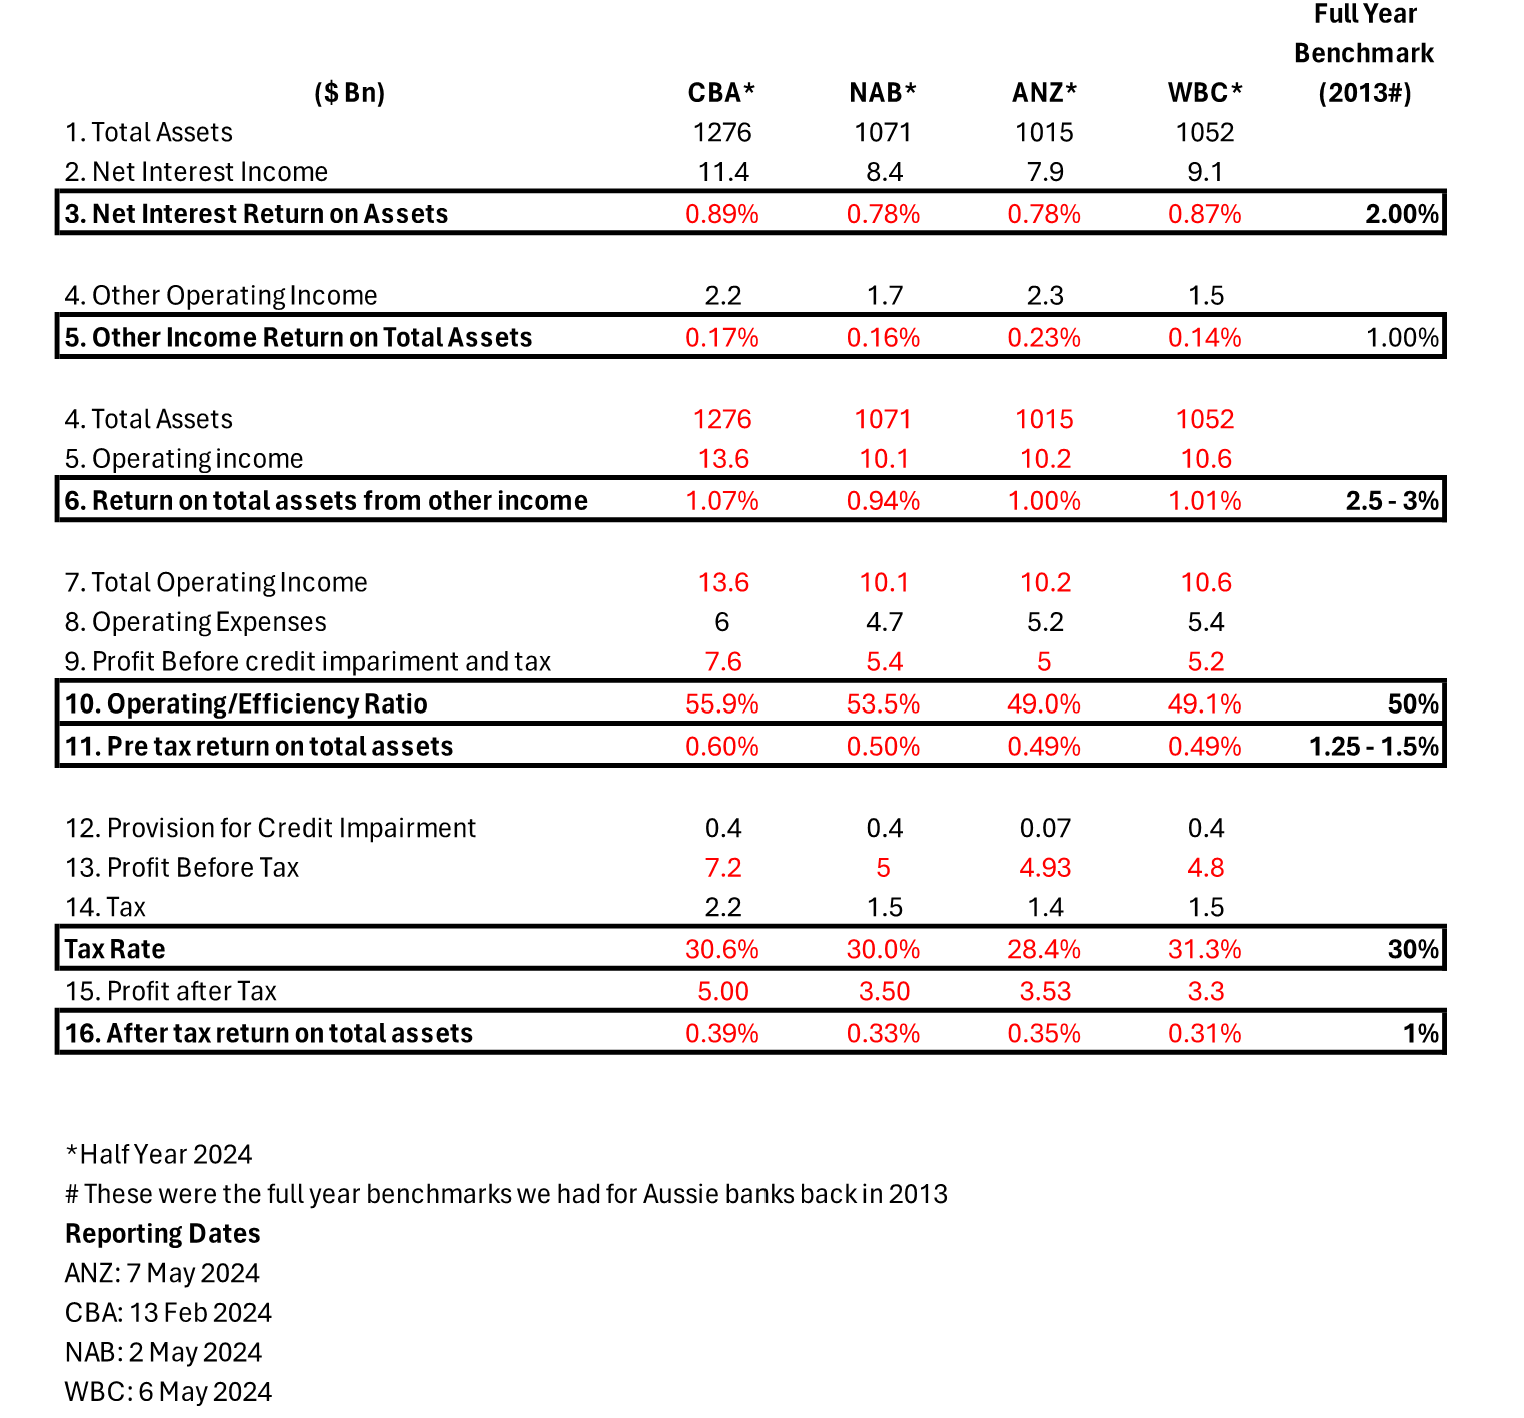
With the above in mind, and noting benchmarks are provided are for full-year results, we offer the following half-year 2024 comparison table for Australia’s Big Four banks;
Table 1. The Big Four comparative HY24 results

Table 1., reveals the Commonwealth Bank of Australia (ASX:CBA) has the largest asset base of almost $1.3 trillion, which is approximately $200 billion more than its three competitors. It also appears to be the case that the Commonwealth Bank of Australia is working those assets harder, generating the highest net interest return on total assets, marginally better than Westpac (ASX:WBC) and materially higher than both Australia and New Zealand Banking Group (ASX:ANZ) and National Australia Bank (ASX:NAB), who are neck-and-neck at 0.78 per cent.
Interestingly, despite a smaller asset base, Australia and New Zealand Banking Group was either luckier in its trading or had better traders employed for the half-year, producing a return on assets from other income materially higher than its three competitors.
National Australia Bank produced the lowest combined operating income return on total assets, while the Commonwealth Bank of Australia won that race. The Commonwealth Bank of Australia was also the most efficient in terms of keeping its operating expenses relatively low, with the highest pretax return on total assets.
Provisions for credit impairments were substantially lower for Australia and New Zealand Banking Group than all the others, despite flagging very clear stresses ahead for the economy and its customers. The rest of the banks were in line. Further investigation is warranted here.
When all was said and done, the Commonwealth Bank of Australia produced the highest after-tax return on total assets of 39 basis points, while Westpac brought up the rear at 31 basis points. The range, however, was relatively narrow, and this has been reflected in share price performances over the last twelve months to 10 May 2024, with the National Australia Bank up 29 per cent, Westpac up 22.3 per cent and the Commonwealth Bank of Australia and Westpac up 20.6 and 22.3 per cent, respectively.
With each bank’s position in the oligopoly is relatively stable – thanks in part of customer inertia and the oligopolistic industry structure, and with each one constantly eyeing the others, we find their market shares and relative operating performances rarely vary much in absolute or relative terms. Therefore, trying to pick the short-term outperformance consistently successfully of one bank over the others has often proven to be a fool’s errand.
The Montgomery Fund and the Montgomery [Private] Fund own shares in Commonwealth Bank and NAB. This article was prepared 10 May 2024 with the information we have today, and our view may change. It does not constitute formal advice or professional investment advice. If you wish to trade Commonwealth Bank or NAB, you should seek financial advice.

