Investor Insights
SHARE
Downgrades galore as we head into interim reporting season
With many Australian companies sitting on lofty valuations, woe betide those that disappoint the market. Because, as we have already seen, investors have taken a big stick to companies that cut their earnings outlook.
In the lead-up to the interim results reporting season, the range of trading updates tends to be skewed to the downside, and this period has been no exception, with 26 companies releasing downgrades to guidance since the end of December by our count as compared to 7 upgrades. As of today, we can add Boral and probably Blackmores to the list.
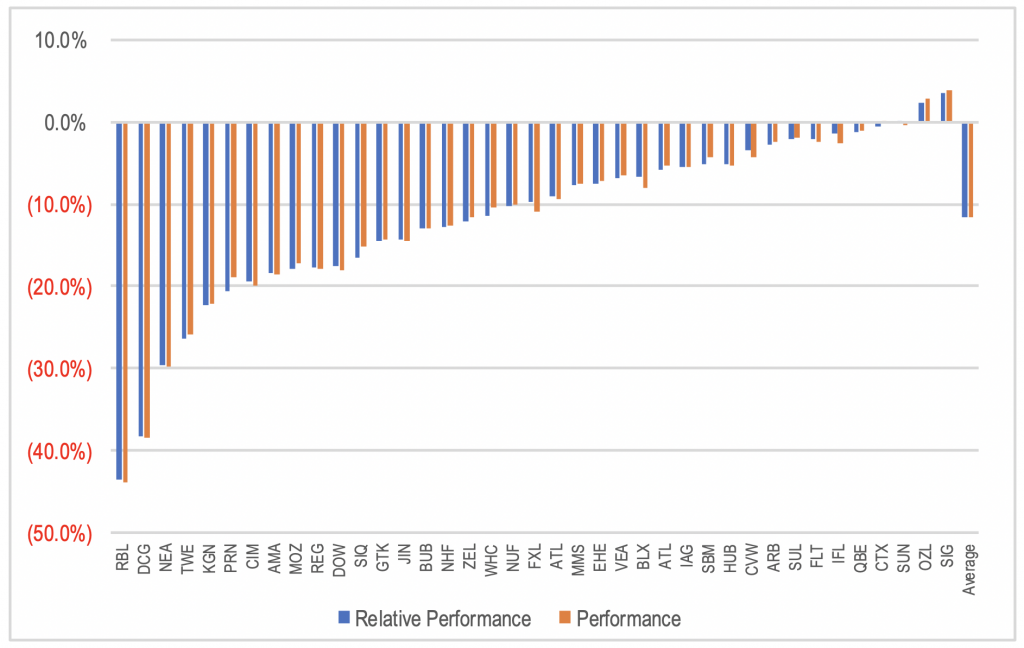
What has been noticeable has been the aggressiveness of the market’s reaction to the announcements, both on the day and since. The charts below show both the absolute share price movement on the day of the announcement (or the following day if the announcement was released after the market close) as well as the change relative to the movement in the ASX 300 index for companies releasing negative trading updates since the start of December.
Figure 1: Change in share price on the day of the announcement

Source: Bloomberg, MIM
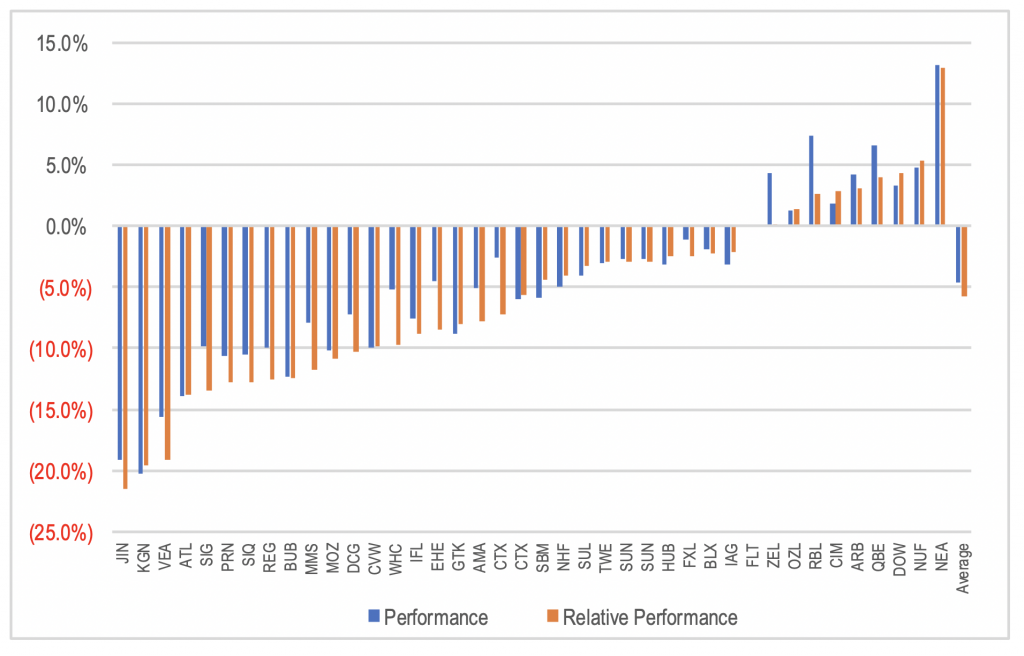
The average performance on the day was -12 per cent. However, these stocks tended to continue to underperform the market after the first day, with average underperformance relative to the broader market since the first of trading post the announcement of -6 per cent.
Figure 2: Change in share price from the first trading day following the announcement to today

Source: Bloomberg, MIM
The change in the share price following the trading update reflects the combination of the change in the expected near-term level of earnings, as well as any changes to the market’s perception of the value of those earnings and future growth. For most of the stocks releasing negative trading updates, the impact of lower near-term earnings expectations on their share price was compounded by a reduction in the market’s perceived value of those earnings.
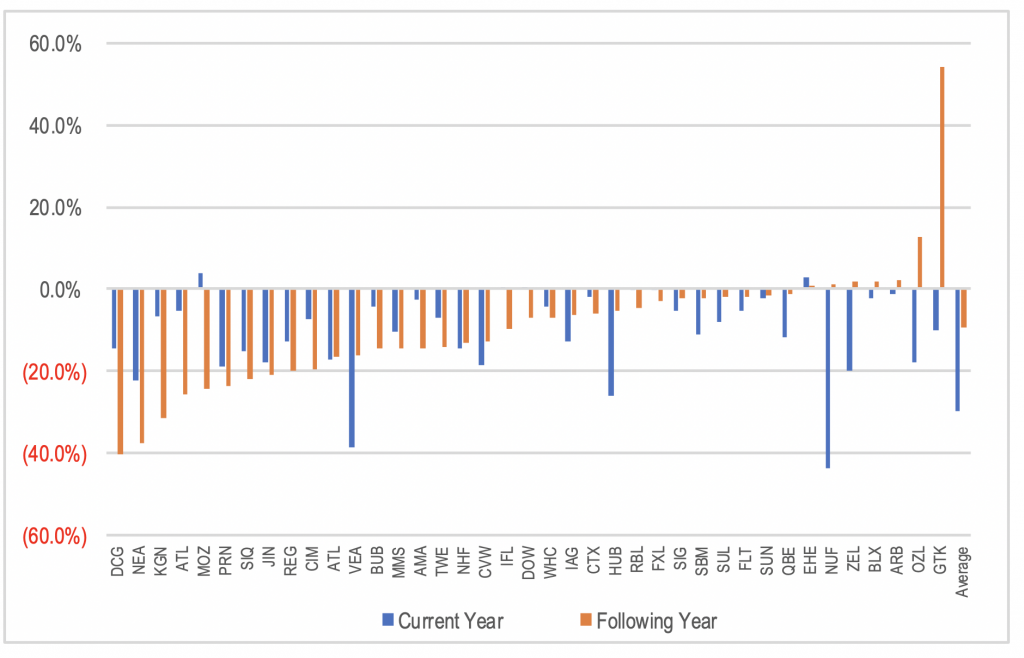
This is shown in the following chart, which shows the percentage change in the company’s PE ratio pre and post the release of the trading update. On average, the stocks downgrading guidance in December and January have suffered a 9 per cent reduction in their PE ratio based on the financial year following the current year.
Figure 3: Percentage change in PE ratio based on average sell side analyst forecast before and after trading update – current and next forecast financial year

Source: Bloomberg, MIM
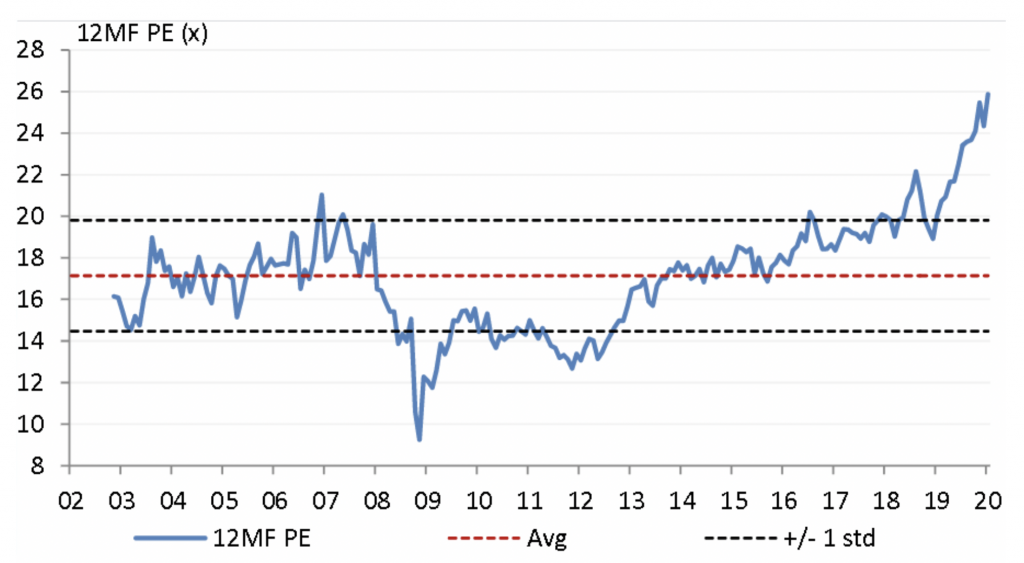
With the market PE having increased materially over the last year on the back of falling discount rates, the price/value attributed to each unit of earnings growth has increased materially. The consequence of this is an increase in companies that disappoint against market expectations. This adds to the risk outlook over the coming reporting season, with surprises likely to result in larger moves in share prices than we have seen previously.
Figure 4: ASX 200 Industrials ex Financials

Source: Morgan Stanley

