

You always learn a lot hearing from seasoned investors. The beauty of the Montgomery business as it has grown is that these nuggets of wisdom through our partner managers are now spread across not only several asset classes but also across a number of geographies.
The Montgomery team recently hosted Damon Ficklin and Rob Forker from Polen Capital, our U.S. based global equity partner manager. Damon is Head of the Large Company Growth Team based out of Florida who are responsible for running their flagship strategy, the Polen Capital Focus Growth Fund, along with the Polen Capital Global Growth Fund. Damon is also Polen’s longstanding investment team member with now over 20 years with the firm. Damon was joined by Rob from the Small Company Growth Team based out of Boston and is responsible for running the Polen Capital Global Small and Mid Cap Fund. Below is a summary of three key learnings from their briefings which I think are all timely reminders for investors in lieu of the world market back drop at present.
#1 Quality is a key driver of investment outcomes over the long term
Polen Capital’s process which has been in operation since 1989 is founded on the principle that investing in the highest quality companies works over the long-term. They define high quality companies initially via the following guardrails: sustained high returns on equity, exceptionally strong balance sheets, stable or growing profit margins, abundant free cashflow and real organic revenue growth. Although investing in high quality has been proven to work over extended periods of time, it doesn’t mean this factor is a driver of investment outcomes of every single time period. This has certainly been our experience at Montgomery working across Australian equities, both large and small.
According to Polen Capital’s research, quality was one of the worst performing investment factors over last calendar year.[1] With that in mind, owning equities is a long-term proposition. As per Figure 1, over long periods of time investing in high quality businesses globally, both large and small, has been a clear driver of outperformance.
Figure 1: Global small and large cap returns by quality tercile (%)
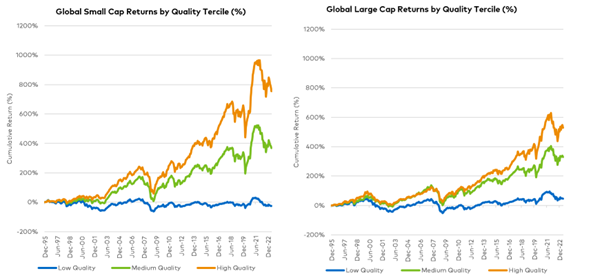
Source: Asness, Frazzini and Pedersen, 2014. Data is publicly available and is updated and maintained by AQR, AQR.com. Dataset Is monthly from December 1994 to 31st May 2023. Methodology: Six portfolios are constructed based on size and quality. The small and large cap breakpoint is defined as: for the US small cap is below the median NYSE market equity and large cap is above and includes all US common stocks on the merged CRSP/XpressFeed data. For international stocks, the breakpoint is the 80th percentile by country and includes all available stocks on the CRSP and Compusta/XpressFeed Global database for 24 developed markets. The Quality measure is based on a score calculated by the average of four factors including Profitability, Growth, Safety and Payout, with high quality exhibiting these factors the most. No representation is being made that any investment will or is likely to achieve future results similar to those shown. Additional information regarding the analyses presented above is available upon request. Performance does not reflect any transaction costs, management fees, or taxes.
#2 The dispersion of returns between large cap and small cap equities is a global phenomenon
Roger has written at length about the differential of returns over the last 18 months between Australian large cap stocks versus their small cap equivalents which sit outside the ASX 100. In fact, as illustrated in Figure 2, this returns gap was close to 30 per cent as at 30 June this year. Interestingly, this is not a local anomaly. Rob from Polen Capital has observed a similar trend across a number of geographies that encompass his investment universe, whether it be U.S., Canada or even Japan. If we look to Figure 3, according to his research global small and mid cap stocks (SMID) are trading at a 10 per cent discount to their large cap equivalents also as at last fiscal year end. Moreover, historically global SMIDs have traded at a 15 per cent premium to their large cap equivalents. As an aside, this premium would be largely attributed to the superior earnings growth potential that these companies have offered investors historically.
Figure 2: Australian Small Ords Accumulation Index versus ASX 100 Accumulation Index
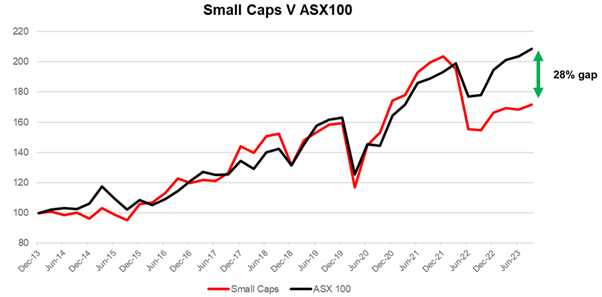
Source: Montgomery Lucent via IRESS, ASX 100 Accumulation Index, ASX Small Ords Accumulation Index returns over last 10 years
Figure 3: MSCI ACWI SMID Cap Index premium versus MSCI ACWI Index
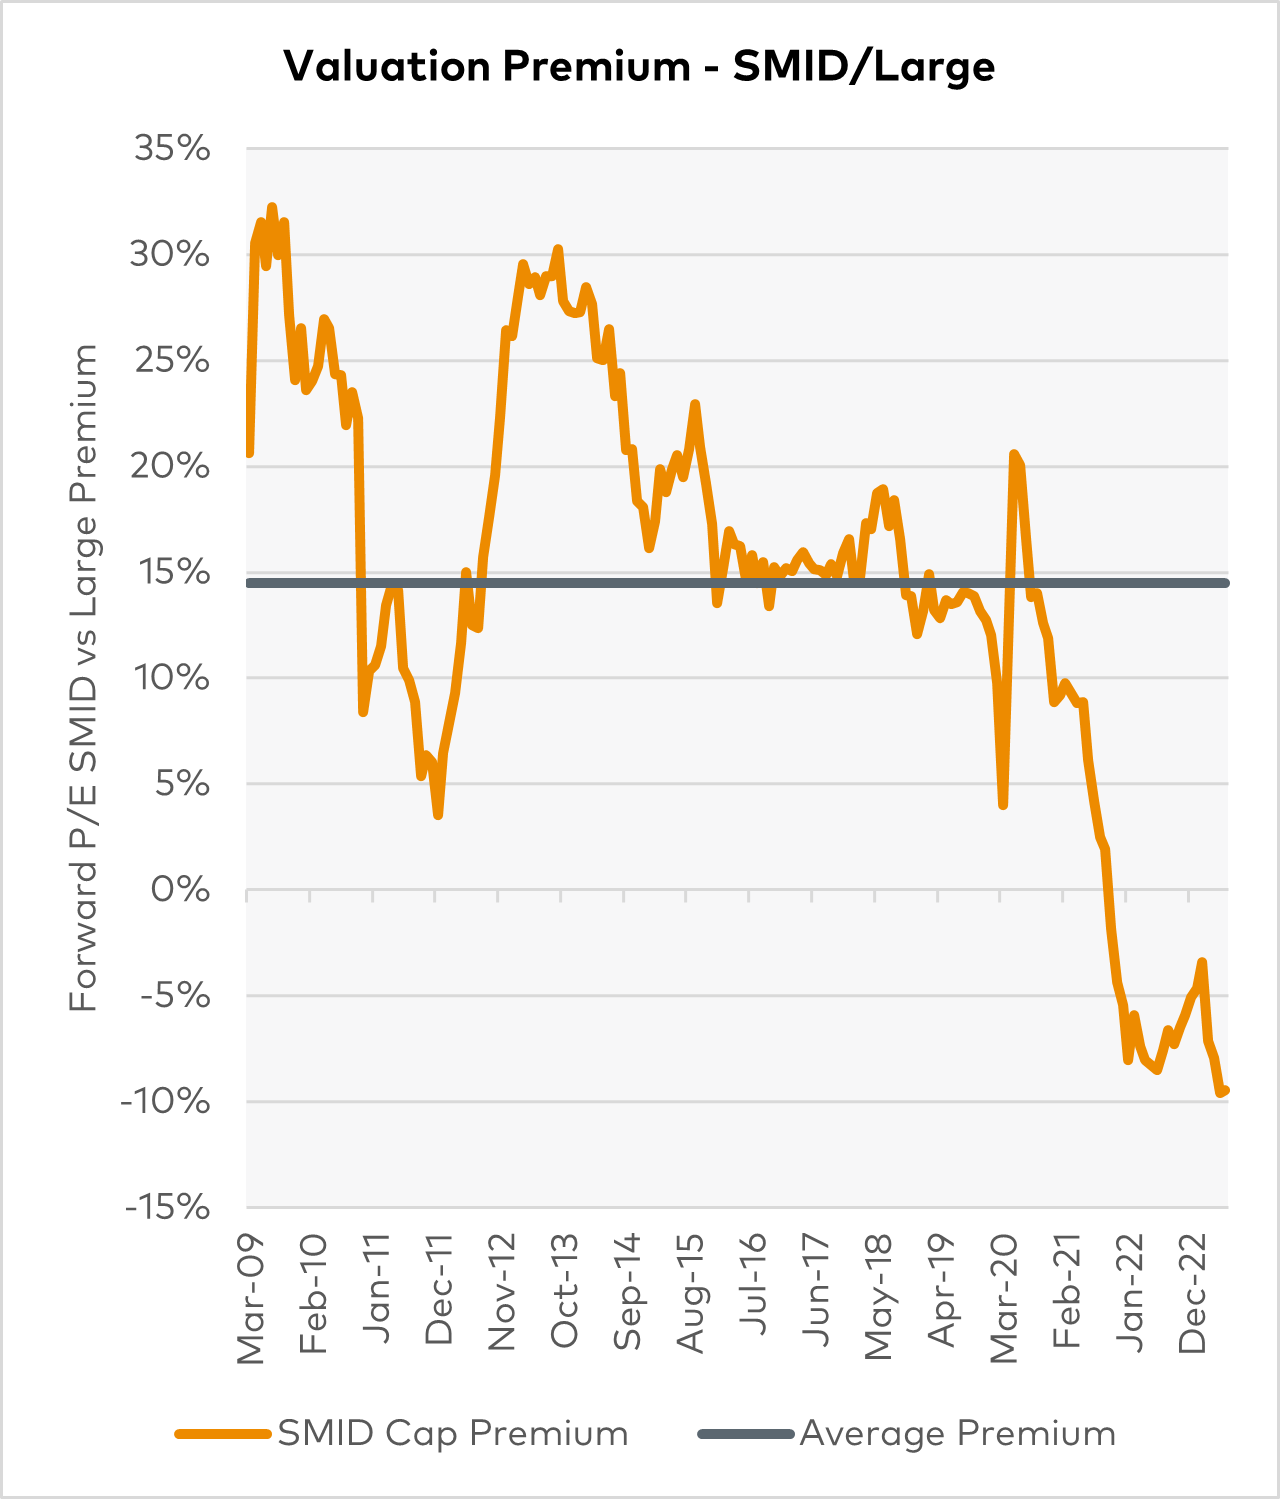
Source: Polen Capital. SMID Cap Premium calculated by dividing the forward P/E multiple of the MSCI ACWI SMID Cap index by the forward P/E multiple of the MSCI ACWI index. Data for the longest available time periods available on Bloomberg; 31st March 2009 to 30th June 2023. Please see Disclosures page. Past performance is not indicative of future results.
#3 The importance of earnings
Said another way, fundamentals matter. Why do they matter? Well, investors can’t control the price movements of a company in the short-term which can often be divorced from the underlying performance of the business. However, if you get the earnings profile right, this can provide you an implicit margin of safety. For example, the Polen Capital Global Growth Fund is seeking to own a portfolio of high-quality businesses where their earnings are forecasted to grow on a blended average of 15 percent over the long term. With reference to Figure 4, if you purchase a business whose earnings over a five-year period (ex-dividends) are forecasted to grow at 15 per cent per annum and assuming the price to earnings (P/E) multiple you pay for this business remains unchanged at 0 per cent over this five-year period, your internal rate of return (IRR) upon selling will be 15 per cent per annum. However, if the P/E multiple was to compress 10 per cent over five years but yet the underlying earnings still grew at 15 per cent per annum over this same period, your IRR would still be 13 per cent. And again, even if the P/E multiple was to compress 25 per cent over five years but yet the underlying earning still grew at 15 per cent per annum over this same period, your IRR whilst not all inspiring would be a modest 9 per cent.
What does this look like in practice? If you take LVMH Group (EPA: MC) which is a current holding in the Polen Capital Global Growth Fund, this company has generated shareholders a total return of 15 per cent per annum since 1989.[2] However, this is not without volatility. Over the last five years, the company has had six drawn downs in its share price north of 10 per cent. Despite this, Polen Capital’s long term earnings growth estimates for LVMH is 12 percent per annum.[3] All of this noting they, at the end of the day, sell products that are non-discretionary. In the case of Louis Vuitton, I will leave you to debate whether their products are non-discretionary with my wife!
Figure 4: The Polen Capital heat map
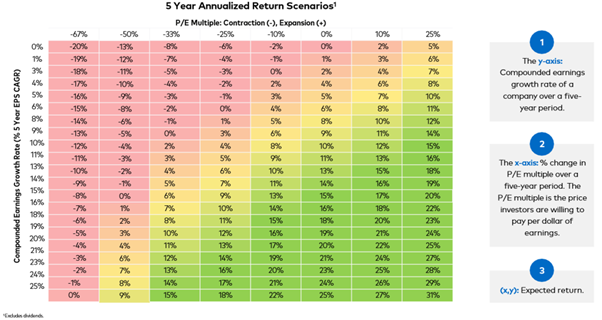
Source: Polen Capital. This page is not intended as a guarantee of profitable outcomes. Any forward-looking estimates are based on certain expectations and assumptions that are susceptible to changes in circumstances. The y-axis = EPS CAGR over five-year period. EPS (earnings per share) measures a company’s profits per share of stock. CAGR (compounded annual growth rate) is the average annual growth rate over time. Together, the EPS CAGR is the annual rate at which a company grows it earnings per share. The x-axis = % change in P/E multiple for a five-year period. The P/E multiple or ratio measures the price investors are willing to pay per dollar of earnings. It can be used to determine a company’s valuation. In times of multiple expansion, investors pay more per dollar of earnings and the reverse is true in times of multiple contraction. This affects expected returns for a particular investment. Methodology and Assumptions: The calculation methodology assumes that the 5-year EPS CAGR will match 5-year annualized return excluding dividends if there no change in the P/E multiple. The calculation is as follows: [(1+% Change in PE Multiple)*[(1+EPS CAGR)5 ]1/5. There are numerous other factors which have not been fully accounted for in the preparation of these results which could adversely affect actual results. There is no guarantee that performance will follow earnings growth. This example is for illustrative purposes only and has been prepared based on assumptions believed to be reasonable; however, there is no guarantee that any forecasts made will come to pass. There may be several unexpected developments and market factors which may affect these scenarios, potentially adversely. There are certain inherent limitations. No representation is being made that any investment will or is likely to achieve future results similar to those shown. This information is not intended to be construed to equate to the expected or projected future performance/returns of a Polen Capital investment or portfolio. The opinions and views provided by Polen Capital constitute the judgment of Polen Capital as of the date of this article, may involve a number of assumptions and estimates which are not guaranteed, and are subject to change without notice. Although the information and any opinions or views given have been obtained from or based on sources believed to be reliable, no warranty or representation is made as to their correctness, completeness or accuracy. Opinions, estimates, forecasts, and statements of financial market trends that are based on current market conditions constitute our judgment and are subject to change without notice, including any forward-looking estimates or statements which are based on certain expectations and assumptions. The views and strategies described may not be suitable for all clients. References to specific securities, asset classes and financial markets are for illustrative purposes only and are not intended to be, and should not be interpreted as, recommendations. This document does not identify all the risks (direct or indirect) or other considerations which might be material when entering any financial transaction. The volatility and other material characteristics of the indices referenced may be materially different from the performance achieved by an individual investor. In addition, an investor’s holdings may be materially different from those within the index. Indices are unmanaged and one cannot invest directly in an index. MSCI ACWI SMID Cap is a market capitalization weighted equity index that measures the performance of the mid and small-cap segments across developed and emerging market countries. The index is maintained by Morgan Stanley Capital International. The MSCI ACWI Index is a market capitalization weighted equity index that measures the performance of large and mid-cap segments across developed and emerging market countries. The index is maintained by Morgan Stanley Capital International.
[1] Bloomberg and Polen Capital, as of December 31, 2022. 1 Factor Returns: Defined, modeled, and calculated by Bloomberg, help decompose returns into a combination of style, industry, geography, and currency exposures. Style factor exposures are estimated for the MSCI ACWI index based on underlying fundamental and security characteristics as defined by Bloomberg’s Equity Factor models. Relative factor returns calculated by Bloomberg as the top quintile returns minus the bottom quintile returns.
[2] Source: Polen Capital via company filings of March 31, 2023
[3] Source: Bloomberg, Polen Capital as of 30 June 2023.