

What do you see when you check under the hood of a ‘balanced’ portfolio managed by some industry funds? A very long list of assets with varying tail risks. Read on, and you’ll see that comparing balanced, multi-asset portfolio across industry and retails funds is no easy feat.
In late 2018, I wrote an article discussing the rise in the promotion of industry funds and suggested that it isn’t as simple for investors to compare the returns of industry funds with their risk bucketed equivalent (you can access this article here). The main reason why was because the broader risk categories for the industry funds, for example conservative, balanced, growth and high growth, often didn’t correctly reflect the assets within the fund itself by traditional definitions. Comparing a balanced industry fund to a balanced equivalent on a returns alone basis was missing a key component in any investors assessment – risk. Of course, when markets are kind to most asset classes and flows of money followed into these funds (as they did in 2019), this hasn’t been an issue. But in periods of sustained volatility and extended uncertainty which we face now in markets, the industry fund debate has resurfaced for another reason as questions are being asked of these funds more broadly in terms of their underlying assets and ultimate liquidity.
To provide some context, I have reviewed the asset allocation (as most readily available) across four actively managed, “balanced” multi-asset funds that should be well recognised: HostPlus, Australian Super, Russell Investments and Colonial First State. These allocations are shared below.
Upon review, it is very easy to see why these strategies, albeit “balanced,” are very hard to compare from an asset allocation perspective. Firstly, each fund categorises its asset classes slightly differently, for example splitting out developed and emerging market equity exposures, or similarly property and infrastructure allocations. Secondly, when they publish such data doesn’t always exactly coincide. Typically reporting is quarterly for most multi-asset strategies; however some industry funds only do so annually.
To draw some observations, according to ratings agency Canstar, a balanced fund is typically “a reasonably even mix of safe and risky asset classes.” This is commonly an allocation of roughly 60-70 per cent to growth assets and 40-30 per cent to defensive assets. Through a similar lens, defensives assets are traditionally classified as cash (or cash equivalents), and fixed interest according to the ASIC Smart Money website.
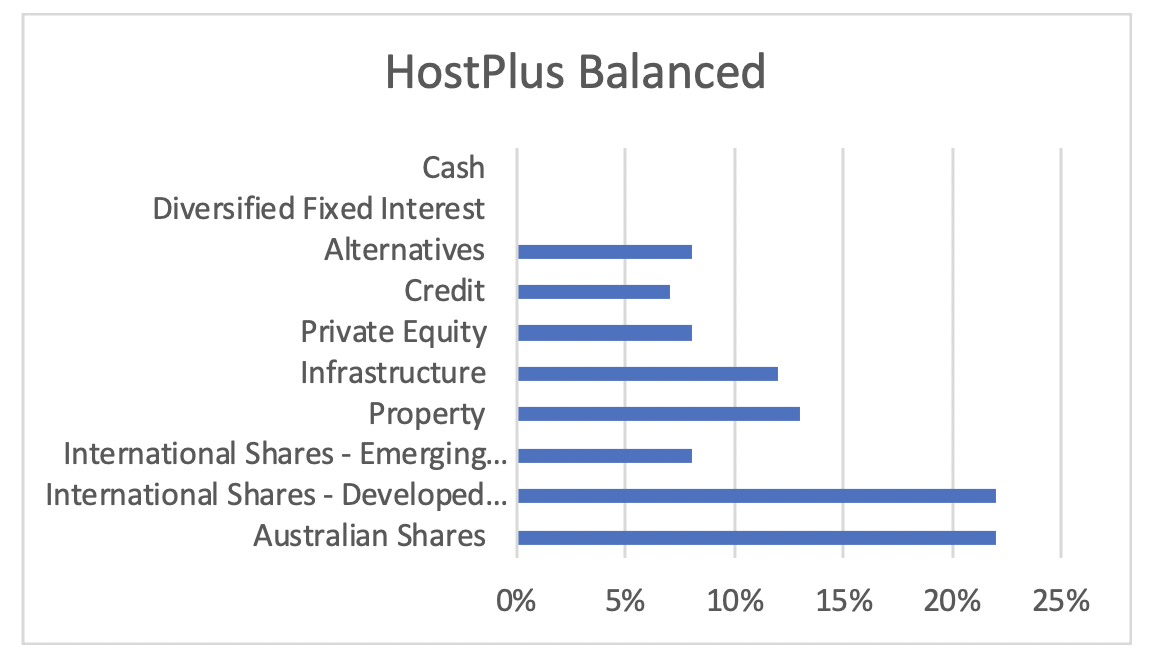
Source: MIM/Host Plus

Source: MIM/Australian Super
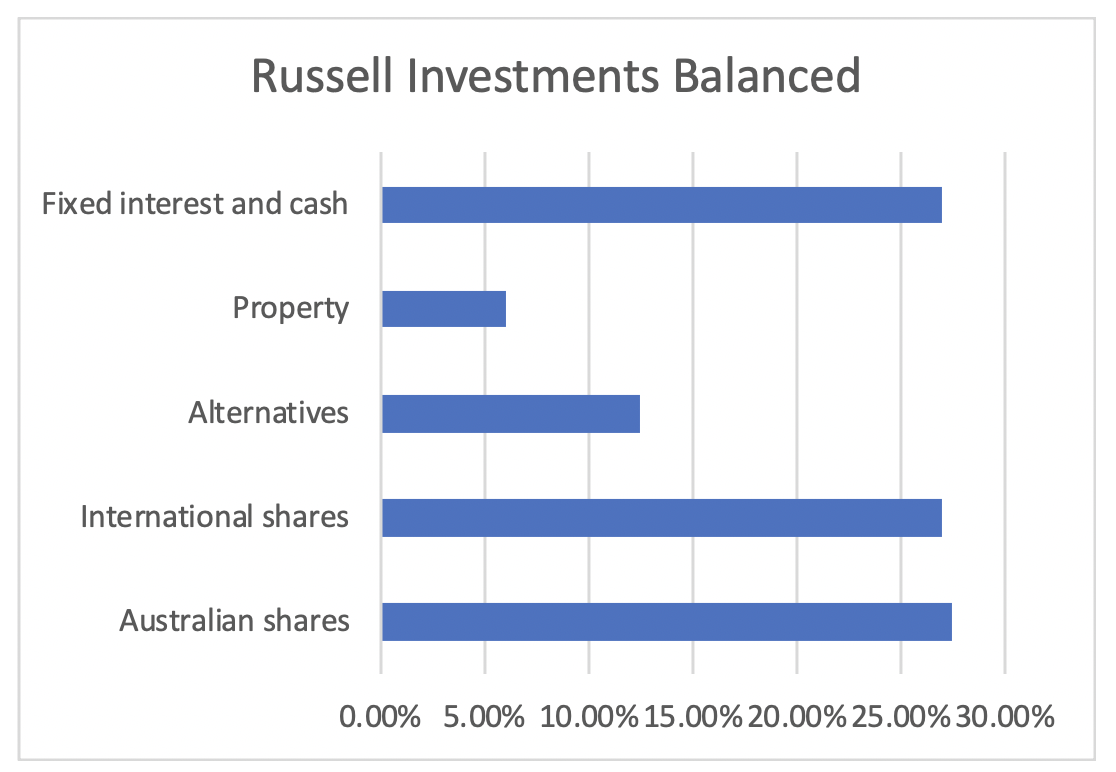
Source: MIM/Russell Investments
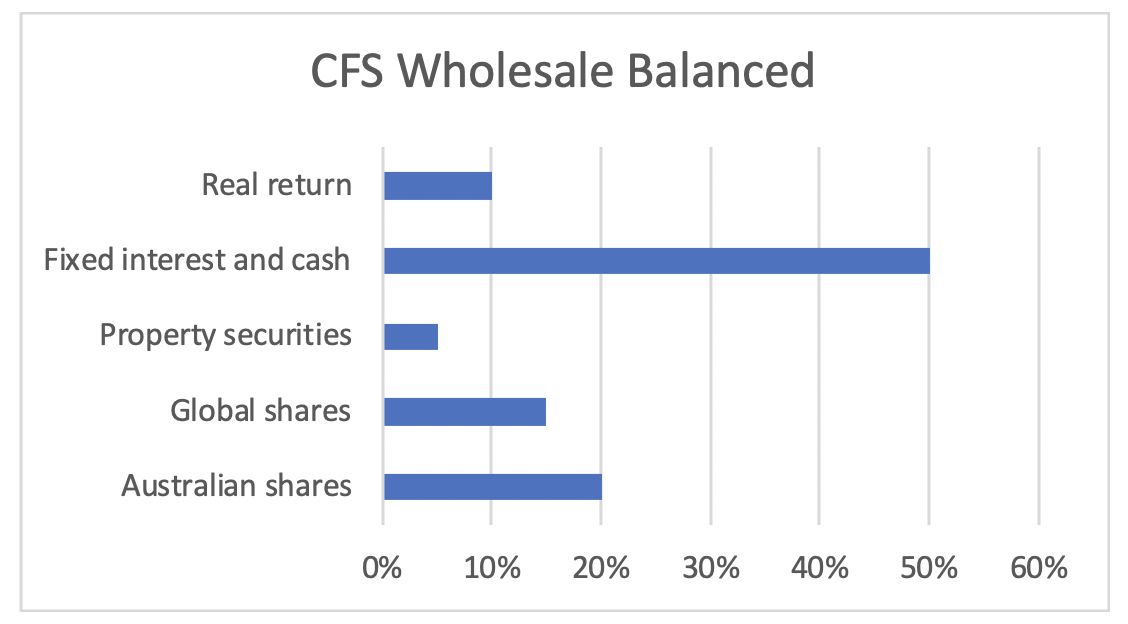
Source: MIM/Colonial First State
So how do these peers stack up under traditional, like-for-like asset allocation measures?
As graphed below, the industry funds clearly have a heavy skew to growth assets despite being labelled as “balanced.” How can this be?
Well, Modern Portfolio Theory (MPT) has evolved beyond traditional measures of asset allocation with respect to growth verse defensive to look at the outcomes of investing in the underlying asset classes from a risk and return perspective. Moreover, if you can overweight growth assets but still achieve a targeted standard deviation for your fund (say, ideal for a “balanced” investor) complemented with higher excess returns over the benchmark, then this is a favourable outcome.
The question becomes a lot more complex if some of these growth assets include unlisted assets that the fund, or its underlying managers, don’t or can’t value frequently. Consequently, how often such assets are “marked to market” does have consequences for the measure of the standard deviation for the fund. To attempt to lift the hood here in the HostPlus Fund to illustrate this complexity, their balanced fund as per their website had an allocation to 66 underlying private equity managers, 13 underlying infrastructure investments (such as university campuses) and 19 underlying property investments (including retail, residential and industrial sites), recalling these assets account for 33 per cent of the overall portfolio. I would have preferred to share the returns of these funds over the last 12 months and since inception to evidence my point around asset allocation and risk, but due to the lack of published return data I am unable to do so.
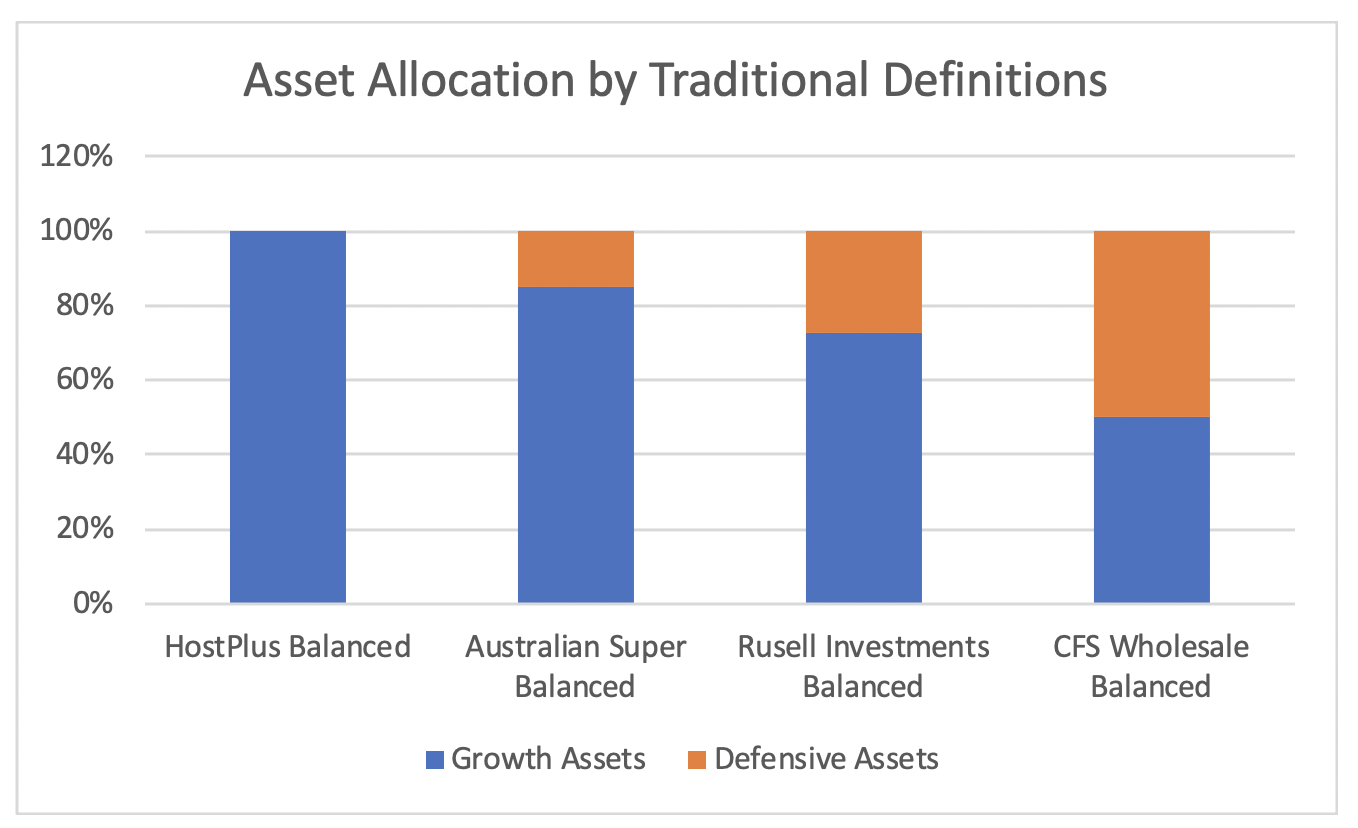
Source: MIM
A spanner in the works
The Morrison government is doing what it can to help those struggling in these challenging times, including the early release super monies of up to $20,000 over the next two financials years. Given there is only a few months left in this financial year, the first release of $10,000 will begin soon as applications have only recently opened. The Treasury estimates say this could be as much as $27 billion in redemptions over the prescribed period, but those in the industry are thinking it will be closer to $40-$50 billion. For most multi-asset funds this is not a huge concern as there are several levers they can pull:
In light of this, the issue will be more prevalent for funds where the only liquidity they have to rely on is equities and they face a triple whammy: high fund redemptions, low fund inflows and highly volatile equity markets and forced selling, all over the same period. Hence the famous saying, when liquidity is needed it is an inch high and a mile wide.
Of course, there are a lot of moving parts here which are hard to quantify at the minute: how long will this state of lockdown continue? How soon before people can return to full earnings? How many people will actually choose to exercise the early release of super as an option and importantly when? And of course, the billion-dollar question, what will markets do over the next two financial years?
For HostPlus, who you would argue given their immediate member base are potentially most impacted by such redemptions, you would hope the trustee has prepared the fund to provide more liquidity to these investors and their asset allocation has changed drastically since last published. In fact, as recently as two days ago, it looks like they are trying to free up as much as $1.5 billion in one of their property holdings with a further $6 billion in cash available (where this has come from and at what cost is another story). You also would hope that the members in the fund understand the asset allocation skew that has been driving their returns in previous years. For those that are interested in understanding more about accessing their super to support themselves, please visit at ATO’s website here.