
A helpful mental model that we often incorporate into our research process at Montaka Global is Total Addressable Market (TAM) analysis. Through this process, we attempt to estimate how large the revenue opportunity is for a particular business. However, the picture isn’t quite as linear as it sounds.
For example, take the advertising industry as it currently stands. Last year (2019), the world spent US$511 billion on advertising (excluding China), of which US$261 billion (approximately 51 per cent), was spent on TV commercials, print ads, radio, billboards, etc (“offline” advertising) and the balance (US$250 billion) was largely spent advertising on Google and Facebook with the pair representing more than 80 per cent of online TAM combined. Now Google and Facebook derive nearly all of their revenue by selling online advertising, hence a cursory glance at the TAM picture might suggest their revenue opportunity is approaching saturation point and are set for imminent decline (given they already have 80 per cent share). However, before we lean too far into this hypothesis and write off two of the highest quality businesses in the world, let’s imagine it is 1999, when Google was pitching its online advertising model and its now ubiquitous search engine to investors.
In 1999 online ads represented only around 2 per cent of the market or approximately US$4.8 billion, which would represent Google’s TAM (Total Addressable Market). For many this would not be a compelling proposition and what would become one of the greatest investments of all time, would be ruled-out along with the company’s vision of an online future.
Global Advertising Market Share (ex. China) TAM: $272bn (1999) -> $511bn (2019) -> $630bn (2024e)
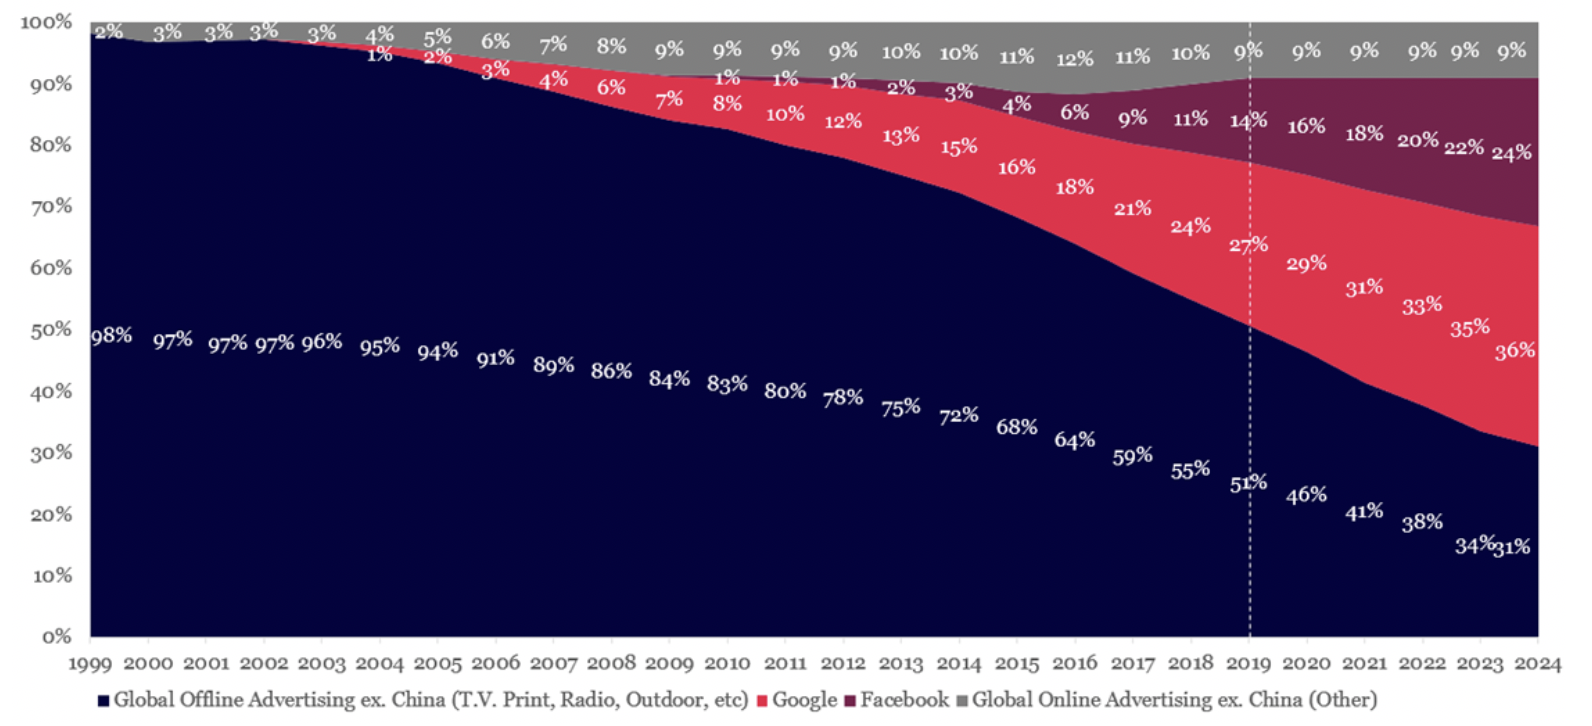
Source: Company Filings; Magnaglobal; Bloomberg; MGI
Obviously predicting Google’s violent disruption of the advertising industry 20 years ago would have been near impossible back in 1999, there is however an interesting lesson here. By using the traditional top-down, TAM framework over the last two decades, an investor would have measured Google’s revenue opportunity (TAM) at each point-in-time and concluded the business was uninvestible as it had already saturated the market. What we are highlighting here is that TAM can be directionally misleading, not only in the early years of a true disruption, but at practically any point along the path. As disruptive technologies / businesses tend to consume adjacent markets, make others obsolete and create entirely new ones along their journey, it is incredible difficult to determine what is reasonable and what is not when assessing TAM.
In Part II of this blog we will consider some of the techniques the team at Montaka Global use to help us identify when a disruption is potentially on the verge of a massive inflection or if in fact, there is no upside beyond what has already been achieved for a business.